Credit Curve: What Is It, Indicator for Investors
The credit curve is an essential concept in finance, particularly in bond markets and corporate debt analysis. It represents the relationship between the interest rates (yields) on a company’s or government’s debt and the time until that debt matures.
Key Takeaways
What the credit curve is and how it works.
Different types and their significance.
Why it matters for investors and businesses.
How economic conditions impact it.
A real-world example with a graphical representation.
What Is the Credit Curve?
Also known as the corporate yield curve, it is a graphical representation of the interest rates associated with different bond maturities. It helps investors understand how a company’s borrowing costs change over time.
Basic Example
Consider two individuals who need a loan:
- The first borrower needs one thousand dollars for one year and offers to repay it with three percent interest.
- The second borrower needs one thousand dollars for five years and offers six percent interest.
Since the second loan has a longer term, there is a greater risk that the borrower might not be able to repay. To compensate for this risk, the lender demands a higher interest rate. When this concept is applied to bond markets, the credit curve takes shape.
How the Credit Curve Works in Bond Markets
In bond markets, the credit curve illustrates how much investors require in return for lending money over different time horizons. Below is an example for a company issuing bonds.
| Maturity | Yield (Interest Rate) |
|---|---|
| One year | 3.5 percent |
| Three years | 4.2 percent |
| Five years | 5.1 percent |
| Ten years | 6.3 percent |
A normal curve slopes upward, meaning longer-term bonds have higher interest rates than short-term bonds. This reflects the additional risk investors take when committing their capital for a longer period.
Types of Credit Curves and Their Meaning
The shape of the credit curve provides insights into the economic environment and the financial health of companies.
Upward Sloping (Normal)
This is the most common type of credit curve. It indicates a stable economic environment where longer-term bonds have higher yields than short-term ones. Investors expect growth and demand higher returns for holding debt over extended periods.
Flat
A flat curve occurs when short-term and long-term yields are nearly identical. This suggests uncertainty about future economic conditions. It may signal a period of economic transition where investors are unsure about risk levels.
Inverted
This type occurs when short-term interest rates exceed long-term rates. Historically, an inverted curve has been a reliable predictor of recessions. Investors expect future interest rates to decline due to economic slowdown, leading to higher demand for long-term bonds and lower yields.
Below is a graph illustrating the three types of credit curves.
Graphical Representation
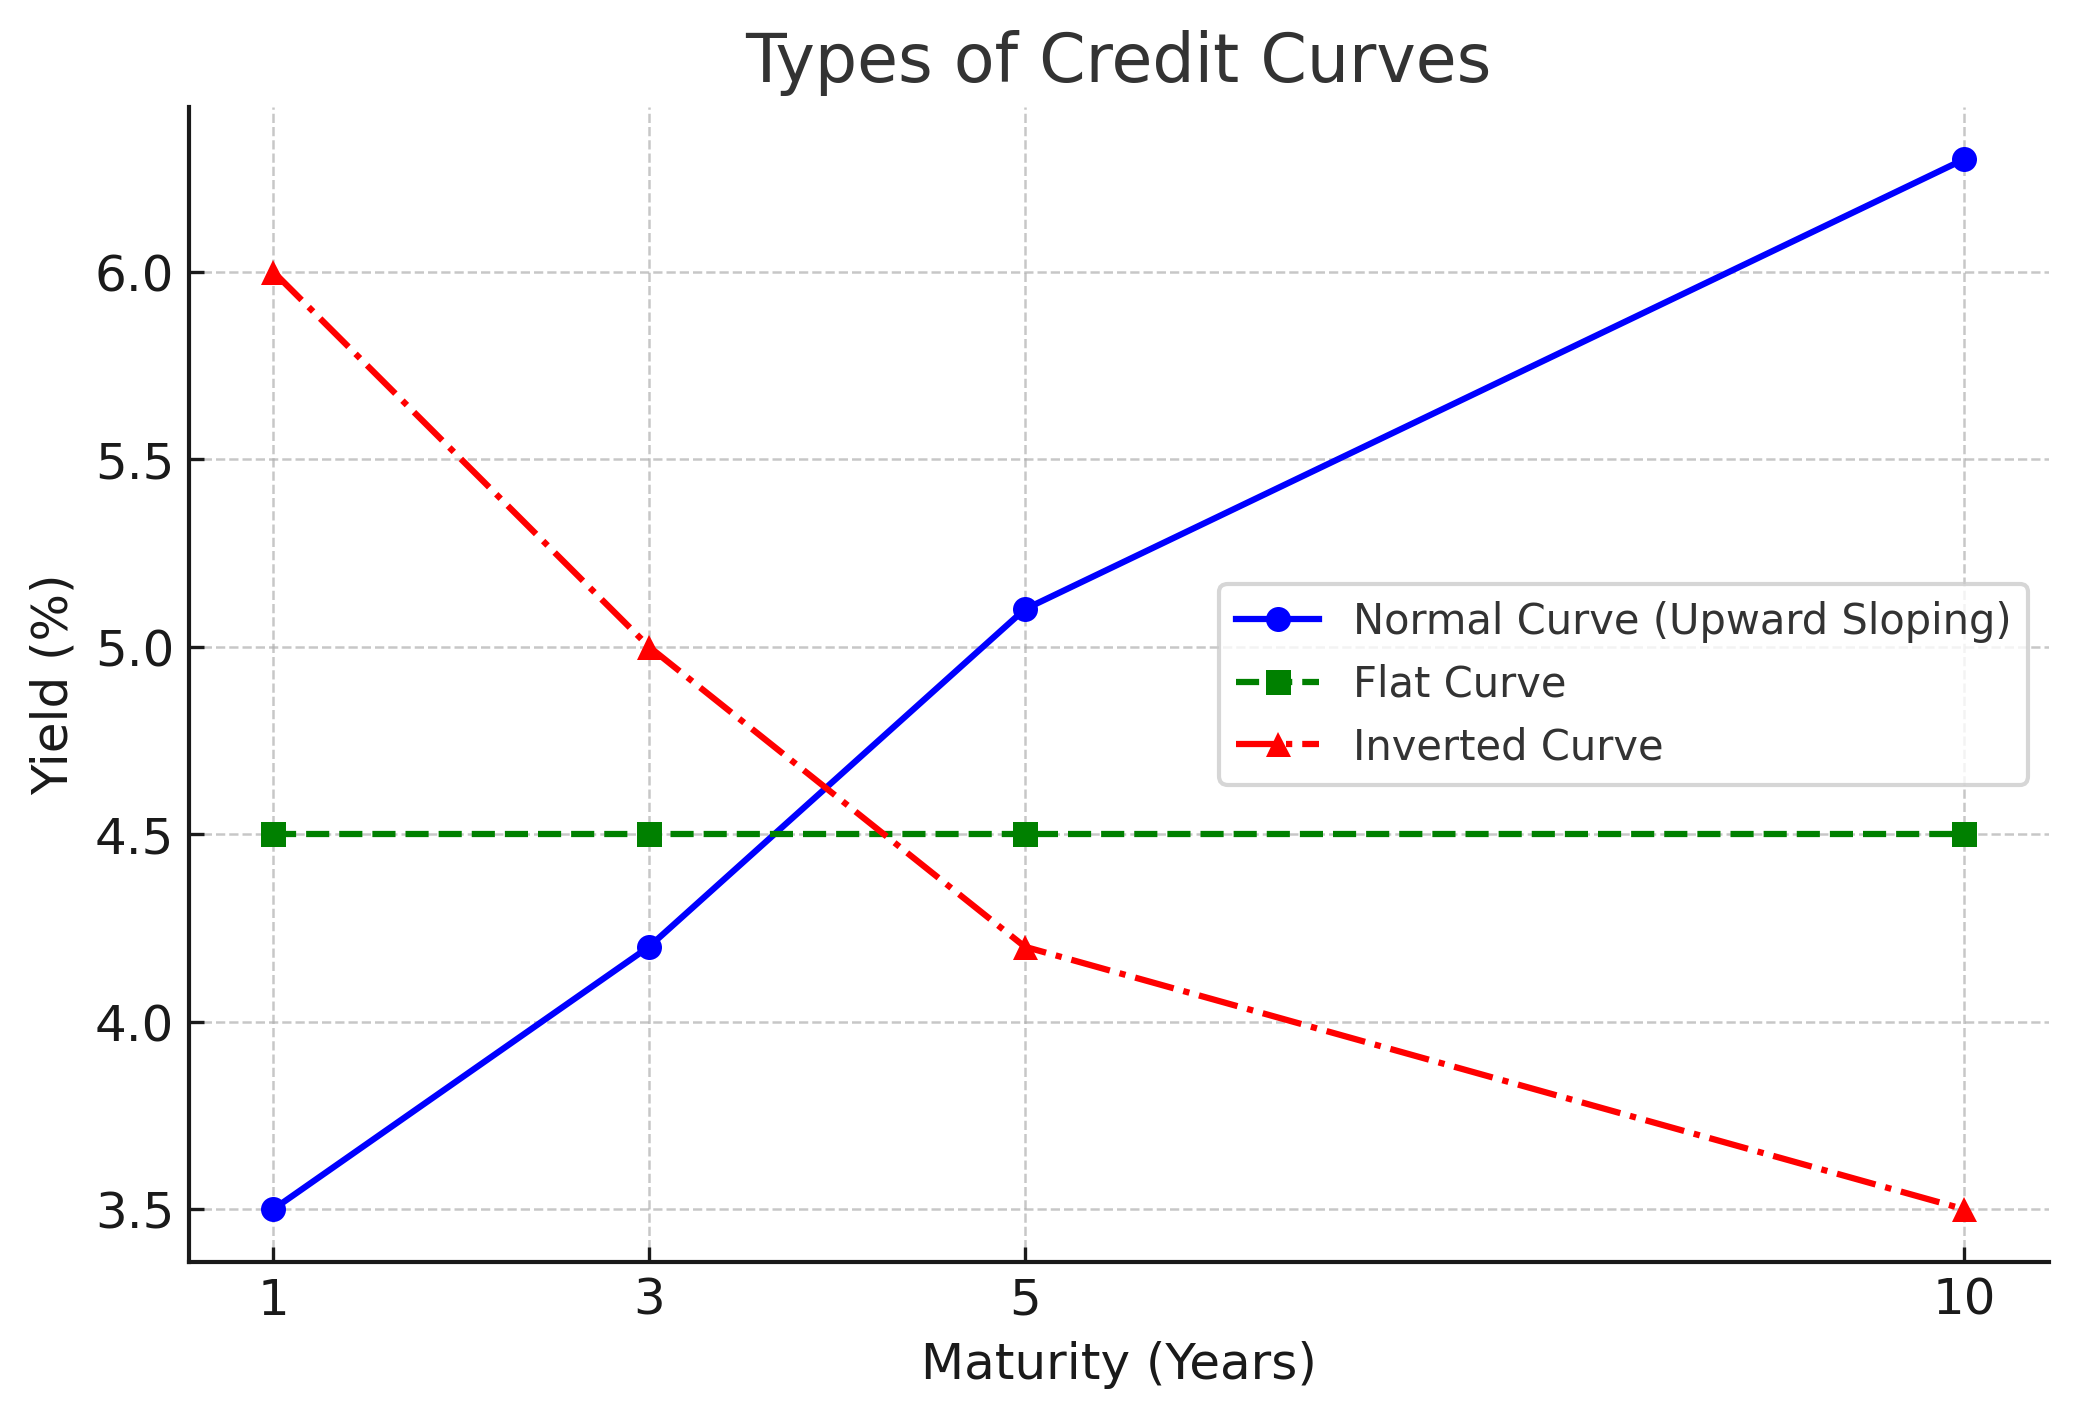
- The blue line represents a normal curve with an upward slope.
- The green line represents a flat curve.
- The red line represents an inverted curve.
How Economic Conditions Impact the Credit Curve
Several economic factors influence the shape of the curve.
1- Interest Rates and Central Bank Policy
When central banks raise interest rates, short-term yields rise faster than long-term yields, often leading to a flattening or inverted credit curve. When central banks lower interest rates, the curve steepens as short-term rates decline more significantly.
2- Inflation Expectations
If investors expect higher inflation, they demand higher long-term yields to compensate for the reduced purchasing power of money. This steepens it. If inflation is controlled, the curve remains stable or flattens.
3- Economic Growth and Recession Risks
A steep credit curve generally indicates that investors expect strong economic growth. A flat or inverted curve, however, signals fears of economic slowdown or recession.
Real-World Example: The 2008 Financial Crisis
In 2007 and 2008, before the global financial crisis, the credit curve first flattened and then inverted. Investors feared an economic downturn, which led to a sharp rise in short-term borrowing costs while long-term rates remained lower.
Lessons from the 2008 Crisis
- An inverted curve was an early warning sign of economic distress.
- Investors who recognized the signal avoided risky financial assets before the crisis.
- Central banks responded by aggressively cutting interest rates to stabilize the economy.
Why Investors Should Monitor the Credit Curve
The credit curve is a valuable tool for assessing financial markets. Investors and businesses use it to:
- Evaluate the risk levels of different bonds.
- Identify potential investment opportunities.
- Predict economic trends based on interest rate movements.
Conclusion
The credit curve is more than a technical finance concept. It provides crucial insights into economic conditions and market expectations. Whether you are an investor, business owner, or financial analyst, keeping an eye on the credit curve can help in making informed decisions.
For more insights into financial markets and investment strategies, stay updated with our latest articles and expert analysis.
Leave a Reply