Calculate Contribution Margin – Basics, Formula, Overview
In this presentation, we will discuss three key financial concepts: How to calculate contribution margin, contribution margin per unit, and contribution margin ratio. These concepts are closely related but can sometimes be confusing. Therefore, we will break them down step by step to clarify their differences and their significance.
Contribution Margin Per Unit
Before calculate contribution margin, we will build a strong foundation. We will start with the contribution margin per unit. This is the fundamental unit of measurement that helps us understand profitability at a granular level.
The contribution margin per unit represents the amount by which a product’s unit selling price exceeds its total variable cost per unit. In other words, it measures how much revenue remains from each unit sold after covering variable costs.
Formula:
Contribution Margin Per Unit=Selling Price Per Unit−Variable Cost Per Unit
To illustrate, let’s consider an example. Suppose we are selling a coffee mug:
- The selling price per mug is $10
- The variable cost per mug (e.g., materials, direct labor, packaging) is $4
- The contribution margin per mug = $10 – $4 = $6
Importance of Variable Costs
It’s crucial to note that we are not considering fixed costs when calculating contribution margin per unit. Traditional financial accounting focuses on cost of goods sold (COGS), which includes both variable and fixed costs. However, in managerial accounting, we separate costs based on their behavior:
- Variable costs change with production volume.
- Fixed costs remain constant regardless of production levels.
Some might argue that excluding fixed costs makes the contribution margin less accurate. For example, costs like overhead expenses (e.g., rent, salaries) are necessary for production but are not included in variable costs. However, the reason we focus on contribution margin per unit is that it helps managers analyze cost behavior and make short-term business decisions.
Link to the Contribution Margin Income Statement
We have previously seen the contribution margin in the contribution margin income statement. This format presents:
Total Revenue−Total Variable Costs=Total Contribution Margin
The contribution margin per unit serves as a building block for this statement. By knowing the contribution margin per unit and the number of units sold, we can predict future profits and make informed decisions.
Additionally, we can use the contribution margin per unit to convert between unit-level and total financial projections:
- If we know the total contribution margin, we can break it down into per-unit figures.
- If we know the contribution margin per unit, we can estimate the total contribution margin by multiplying it by the expected sales volume.
Contribution Margin vs. Contribution Margin Per Unit
Now that we’ve established the base, contribution margin per unit, let’s examine the contribution margin in total and its relationship with the contribution margin ratio.
Unlike the contribution margin per unit, which focuses on individual products, the contribution margin considers the business’s total revenue and costs. To calculate contribution margin using, we use formula:
Contribution Margin=Total Net Sales−Total Variable Costs.
This is exactly what we see in a contribution margin income statement, where total sales are reduced by total variable costs to determine the contribution margin.
In Practice
When working with financial data, especially in spreadsheets, we often need to analyze both total and per-unit contribution margins. This can sometimes be confusing because financial statements must clearly distinguish between:
- Contribution Margin (Total) – The overall amount left after subtracting total variable costs from total sales.
- Contribution Margin Per Unit – The amount left per unit sold, calculated as:
Contribution Margin Per Unit=Selling Price Per Unit−Variable Cost Per Unit
For example, let’s assume:
- Selling price per unit = $57
- Variable cost per unit = $30
- Contribution margin per unit = $57 – $30 = $27
By multiplying this $27 by the total number of units sold, we can determine the total contribution margin.
Understanding the Contribution Margin Ratio
Now that we’ve covered both total contribution margin and per-unit contribution margin, let’s move on to the contribution margin ratio.
This metric expresses the contribution margin as a percentage of the selling price, helping businesses understand what portion of sales contributes to covering fixed costs and generating profit.
Formula:
Contribution Margin Ratio=(Selling Price Per Unit/Contribution Margin Per Unit)×100
Using our previous example:
- Contribution Margin Per Unit = $27
- Selling Price Per Unit = $57
(57/27)×100=47.37%
This means 47.37% of each sale contributes to covering fixed costs and profit. The remaining percentage (52.63%) covers variable costs.
Importance of the Contribution Margin Ratio
The contribution margin ratio is particularly useful for:
- Break-even analysis – Determining how much sales revenue is needed to cover all costs.
- Profit planning – Estimating the impact of price changes or cost fluctuations.
- Decision-making – Assessing product profitability and identifying areas for improvement.
Using Spreadsheets for Contribution Margin Calculations
When working with Excel or other spreadsheet tools, it’s common to set up tables to calculate:
- Total Contribution Margin
- Contribution Margin Per Unit
- Contribution Margin Ratio
This structured approach allows for quick scenario analysis and better financial planning.
Now that we have explored how to calculate contribution margin, contribution margin per unit, and contribution margin ratio, let’s analyze how these values interact in different formats—both per unit and total.
Breaking Down the Contribution Margin Ratio
As mentioned, the contribution margin ratio is calculated as:
Contribution Margin Ratio=(Selling Price Per Unit/Contribution Margin Per Unit)×100
Using our previous values:
- Contribution margin per unit = $27
- Selling price per unit = $57
57/27≈0.47 or 47%
This 47% means that for every dollar in sales, 47 cents contribute to covering fixed costs and profit.
Ratio Analysis in the Contribution Margin Income Statement
The contribution margin calculation follows a similar logic to gross profit analysis in traditional income statements. However, instead of considering cost of goods sold (COGS), we focus on variable costs.
Using a table format, we see:
| Item | Amount Per Unit | Percentage of Sales |
|---|---|---|
| Selling Price | $57 | 100% |
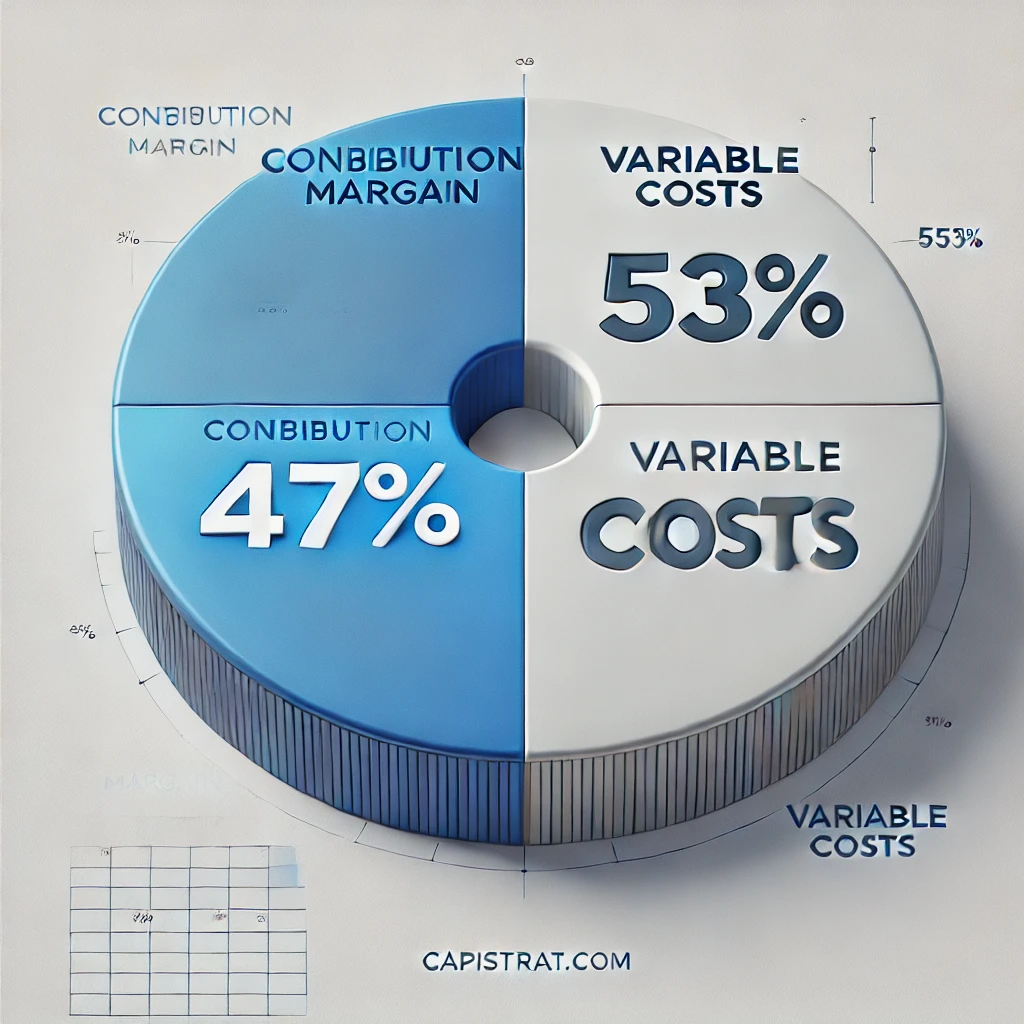
| Variable Cost | $30 | 53% |
| Contribution Margin | $27 | 47% |
As expected, the variable cost percentage (53%) and the contribution margin percentage (47%) add up to 100%.
Similarly, if we were working with total figures, the relationships remain the same:
| Item | Total Amount | Percentage of Sales |
|---|---|---|
| Total Sales | $5,700 | 100% |
| Total Variable Costs | $3,021 | 53% |
| Total Contribution Margin | $2,679 | 47% |
By dividing these total amounts, we get the same ratios: 2,679/5,700 ≈ 47% and 3,021/5,700 ≈ 53%.
Thus, whether using per unit or total sales, the relationships remain consistent.
Importance of Structuring Contribution Margin Tables
When analyzing contribution margin data, always ensure you:
- Clearly differentiate between per-unit and total values.
- Use table headers to indicate whether values represent per-unit or total amounts.
- Double-check ratios by summing percentages to ensure they total 100%.
- Recalculate values from different perspectives to solidify understanding.
Using structured tables in Excel or Google Sheets can help visualize these relationships and perform scenario analysis more efficiently.
Conclusion
Understanding how to calculate contribution margin, per-unit values, and ratios is crucial for cost management, pricing strategy, and break-even analysis. Businesses can optimize pricing, control variable costs, and improve profitability by mastering these concepts.
Leave a Reply